Dallas-Fort Worth House Prices and Trends
Visualize the change in median house prices with a map view of the DFW metroplex by zip code from 2012 - 2021.
Several metrics of the Dallas – Fort Worth housing market are analyzed in this map focused Tableau dashboard. The data spans from 2012 to 2021 and is sourced from Redfin. Change the view between “Median Sale Price” and “Percent Change of Sale Price” by clicking the navigation buttons at the top of the dashboard.
According to this study, residential homes in the Dallas – Fort Worth metroplex saw a price increase of 18.6% from 2020 to 2021, outpacing the national average of 16.9%. The average price of a DFW home in 2021 remains below the national average; $318,000 in DFW versus $347,000 nationally.
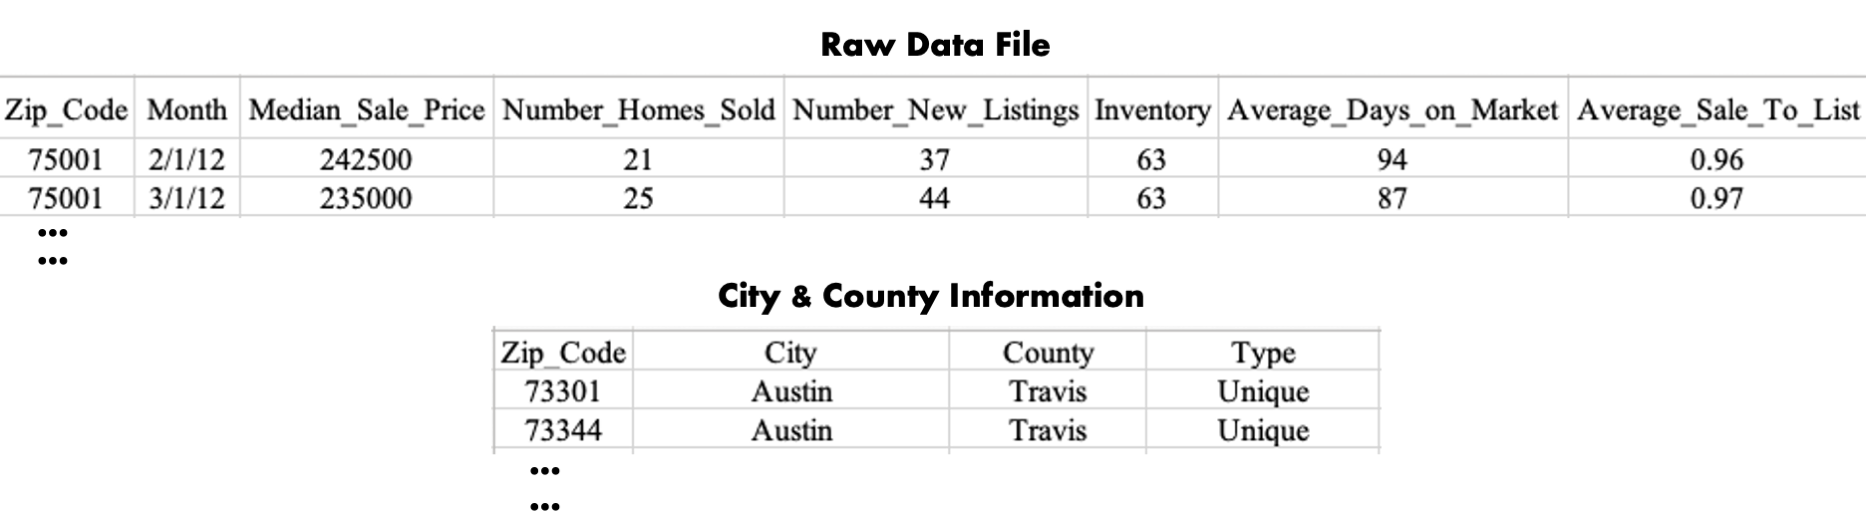
City and county information for each data entry is absent from the raw data file. To later group and filter these data by regions broader than zip code, an additional table detailing the city and county for each zip code was joined to the raw data file during the query process using SQL.
The database was initially queried for the median sale price of homes in each zip code by month. This data was used to build the first dashboard view.
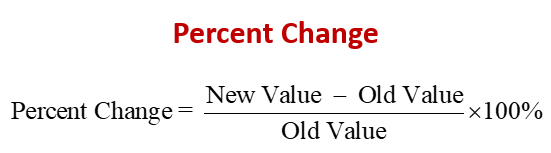
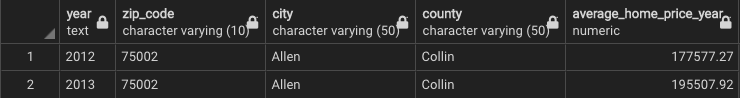
A more complex query was necessary to calculate the percent change in median sale price from year to year. First, the average price of a home within each zip code per year was calculated using a SQL view to temporarily store the data for later calculations. The data needed to be grouped by year, as each entry in the raw data table represents a single month. This required the extraction of the numeric year from the “month” column.
An additional query acting on the previously stored view utilized a combination of lag window functions to achieve the percent change in sale price (year over year). The window functions were partitioned by zip code and ordered by the year. These data were used to build the second dashboard view in Tableau.