Personal Finance and Net Worth
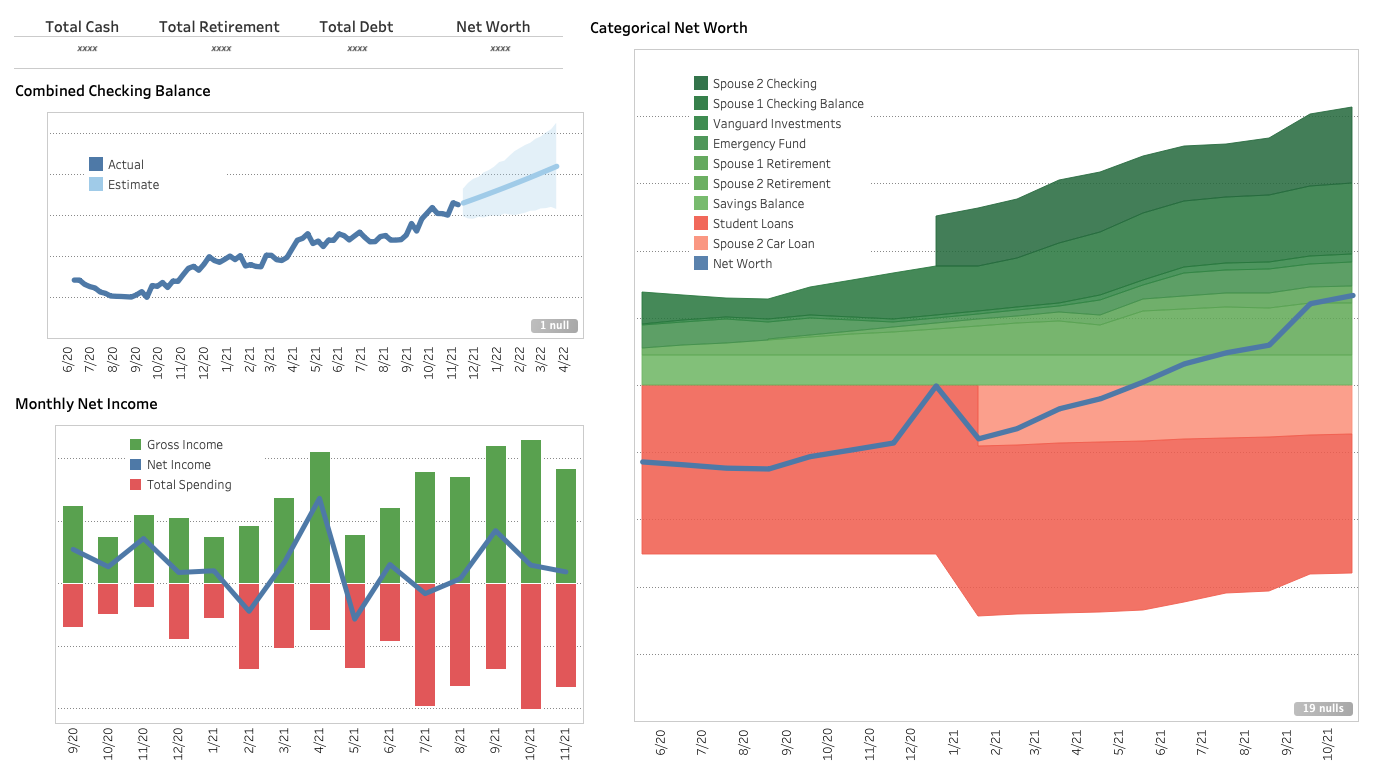
categorical time series of net worth visualizing the magnitude of various assets and liabilities.
I have used the Mint personal finance tracker for many years. Though I believe it is an excellent tool, it has certain visual limitations that I was itching to explore. One such visualization that I desired was the ability to appreciate the unique weight of individual financial assets and liabilities on total net worth through time.
Nine financial account records (e.g. checking, savings, loans) were gathered and converted to a relational database using pgAdmin4.
Six views were created to individually calculate gross income, net income, and total spending for two checking accounts. These views were later utilized in calculations to export data for use in the Monthly Net Income bar chart.
Two views involving window functions were created to yield a time-series balance of the two checking accounts. These views were later utilized in calculations to export data for use in the Combined Checking Balance line graph. Forecasting in Tableau to mid-2022 was also performed on these data.
The categorical area graph of net worth required 8 joins on date. A time series of each account balance and net worth were returned.
The current positions table in the top left of the dashboard was created by limiting the area graph query to the most recent month through a WHERE statement and INTERVAL function.
