Academic Exam Grades
Analyze three distinct exam grades for 85 students in a dynamic dashboard from the perspective of an educator.
Standardized exam scores are utilized by educators as a metric of the academic progress of students. This dynamic dashboard quickly compares exam scores between individual students and students aggregated by class periods with day-to-day assignment averages. In addition, exam scores are deconstructed to the percent correct of individual learning objectives.
The strength of this dashboard lies in the scatter plot. Each student falls in 1 of 4 distinct “Zones” based on the relationship between the student’s exam grade and the student’s day-to-day average. A student’s Zone is suggestive of the student's overall academic performance. Zones may also have unique implications with additional context given by the classroom educator (i.e. a student in Zone 4 may be suffering from testing anxiety, a student in Zone 3 may be ‘gifted’ but not engaged day-to-day). A list of students in each zone is generated with the “Zone Selection” parameter.
The button at the top of the dashboard changes the view to incorporate the percent correct of each learning objective. This secondary view indicates which exam subtopics the students are succeeding or struggling to understand.
Seven data tables containing daily assignment grades, exam grades, and learning objective grades were converted to a relational database using pgAdmin4. Six of these tables were left joined to the table containing daily assignment grades using SQL. Every student name has an associated daily grade, thus the table containing daily assignment grades was chosen as the base table for the join. There is not an exam grade for every student. View the query used to export data below. See the full SQL script here.
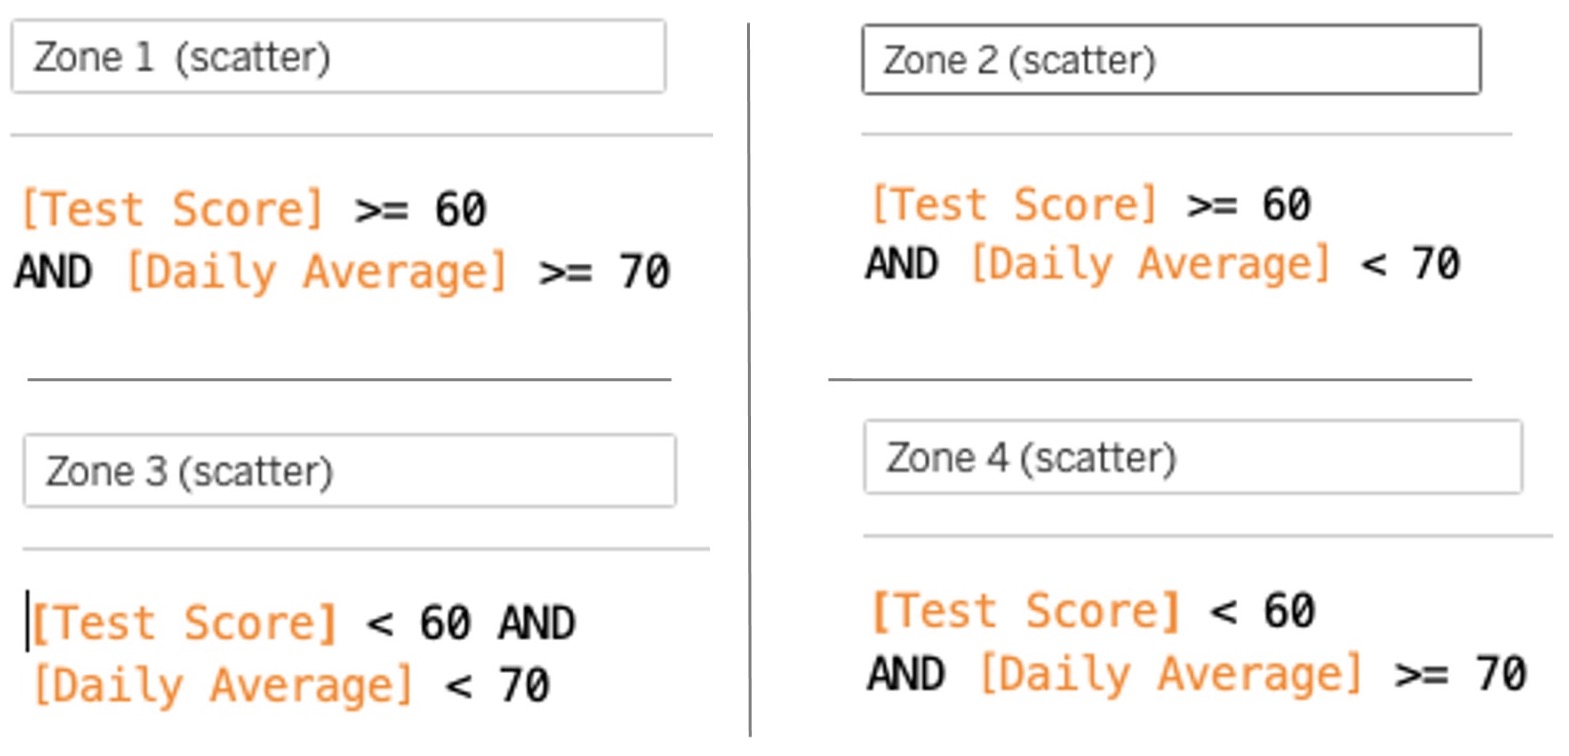
The user-defined data clusters within the scatter plot, or “Zones”, are associated with four calculated fields. Each Zone is defined using a Boolean calculation against a set of linear inequalities. For example, Zone 1 includes students with both an Exam Grade above 60 and a daily average above 70 (see below). These calculated fields are assigned distinct colors in the Marks card.
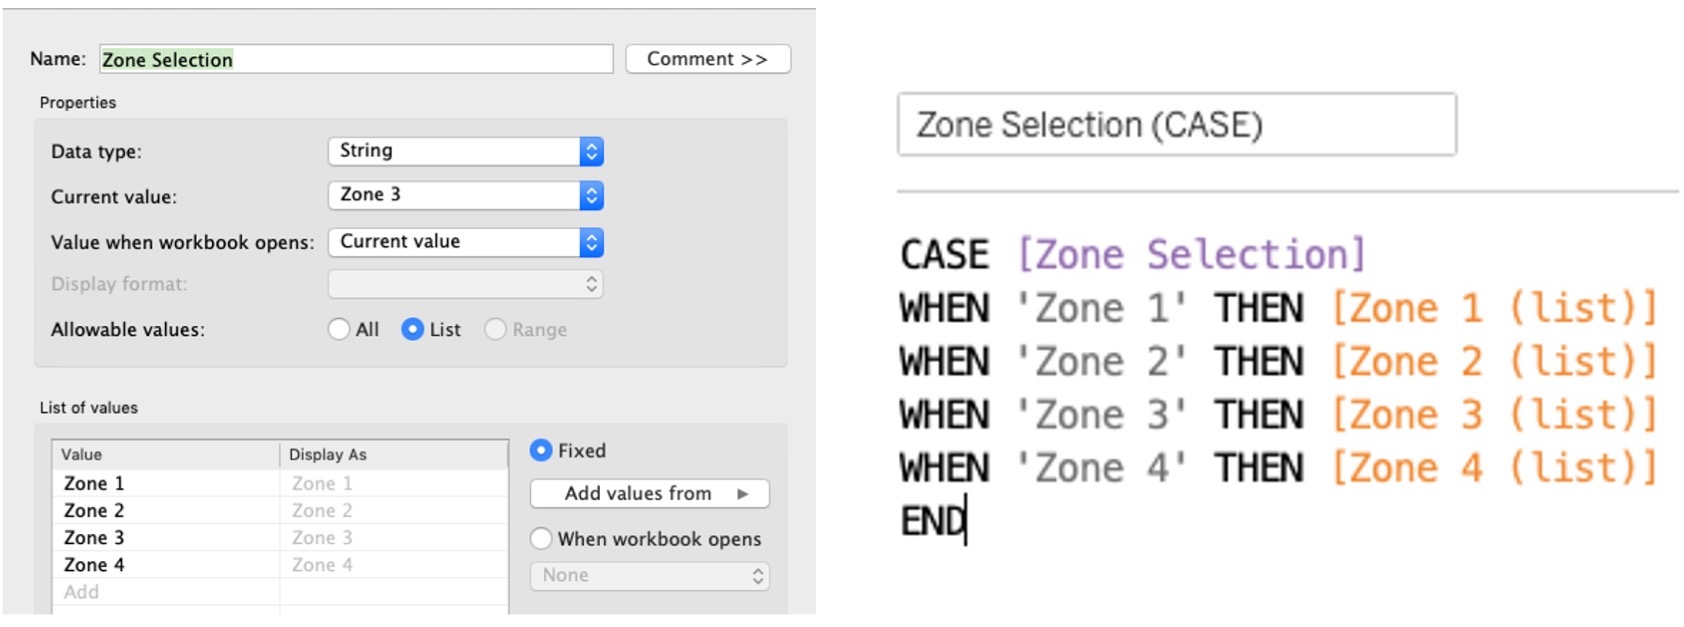
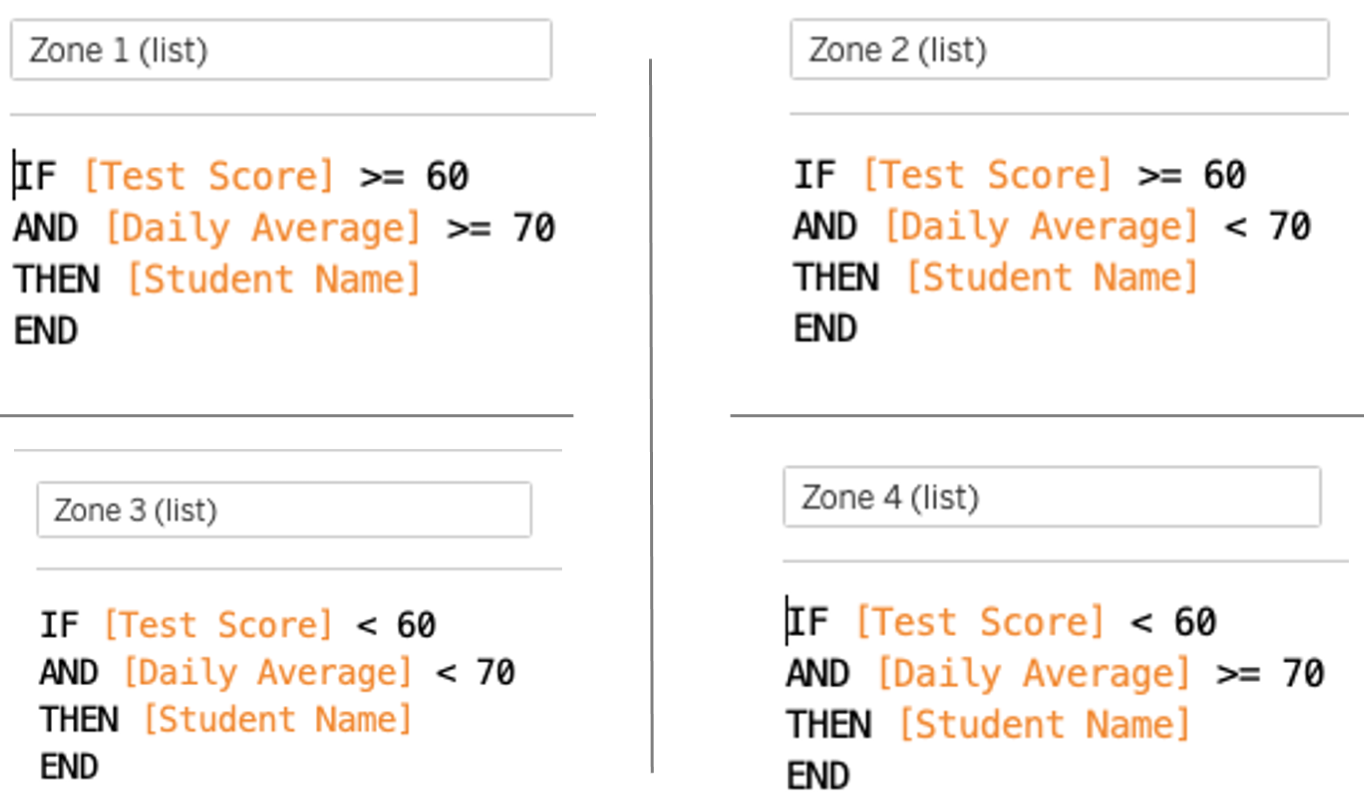
The list of student names within each Zone is generated with a combination of calculated fields and a parameter. The parameter “Zone Selection” allows the user to select from which Zone the list of names populates. The four values within the parameter (Zone 1, Zone 2, Zone 3, and Zone 4) are linked to four distinct calculated fields using a CASE statement. Each linked calculated field contains an IF statement with instructions to populate the names of students who meet the criteria of each Zone (e.g. Zone 1 (list); see below).
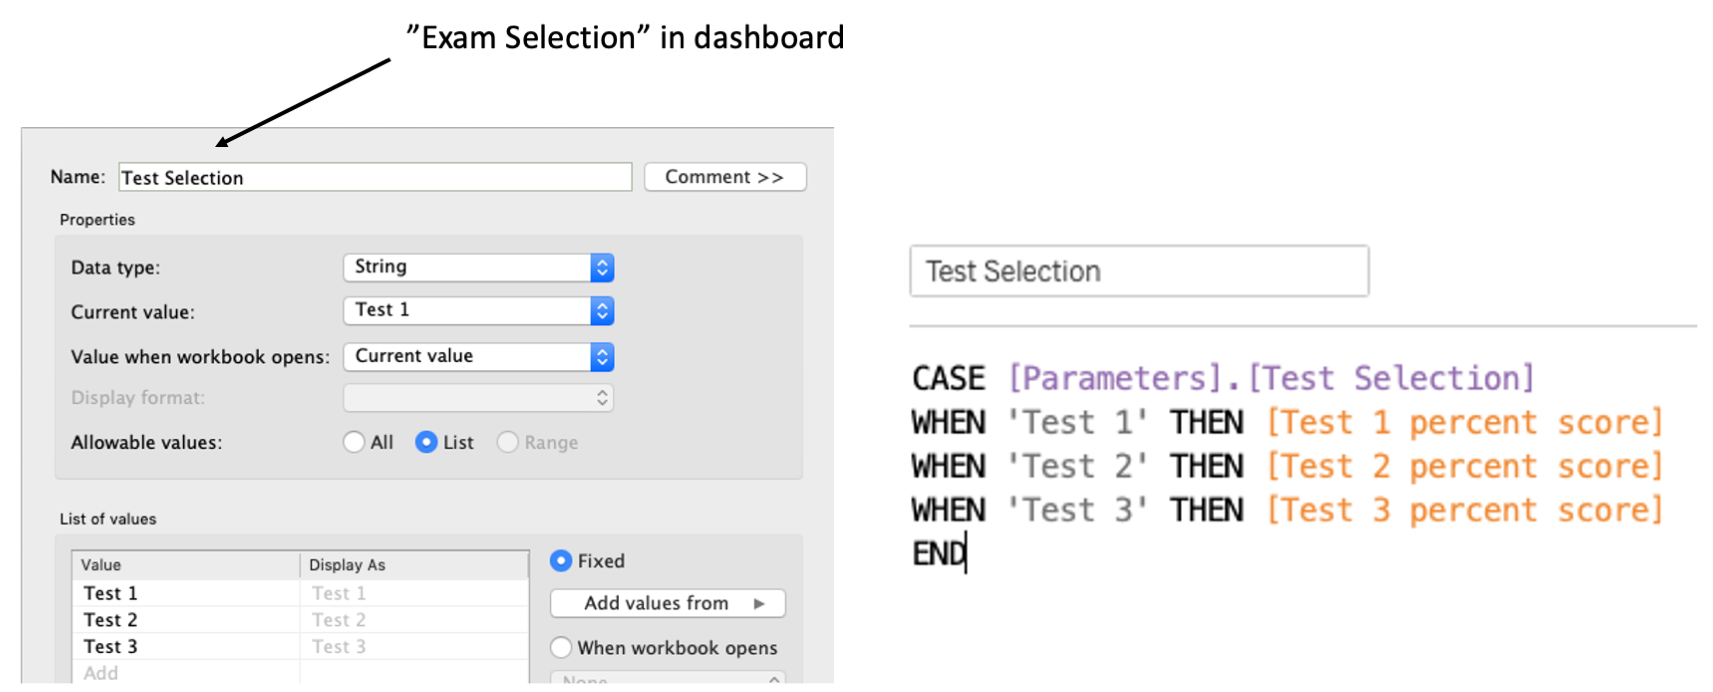
Finally, three distinct exams are incorporated into the dashboard. The data in each plot (excluding the box and whisker plot) adapts to the user selection of a particular exam (Test 1, Test 2, Test 3). Due to several dependencies, this feature could not be accomplished by filtering alone and required the use of another parameter and calculated field (see below).